Case study · Founder & solo builder · Mar 2026 – present
CityRuleLookup
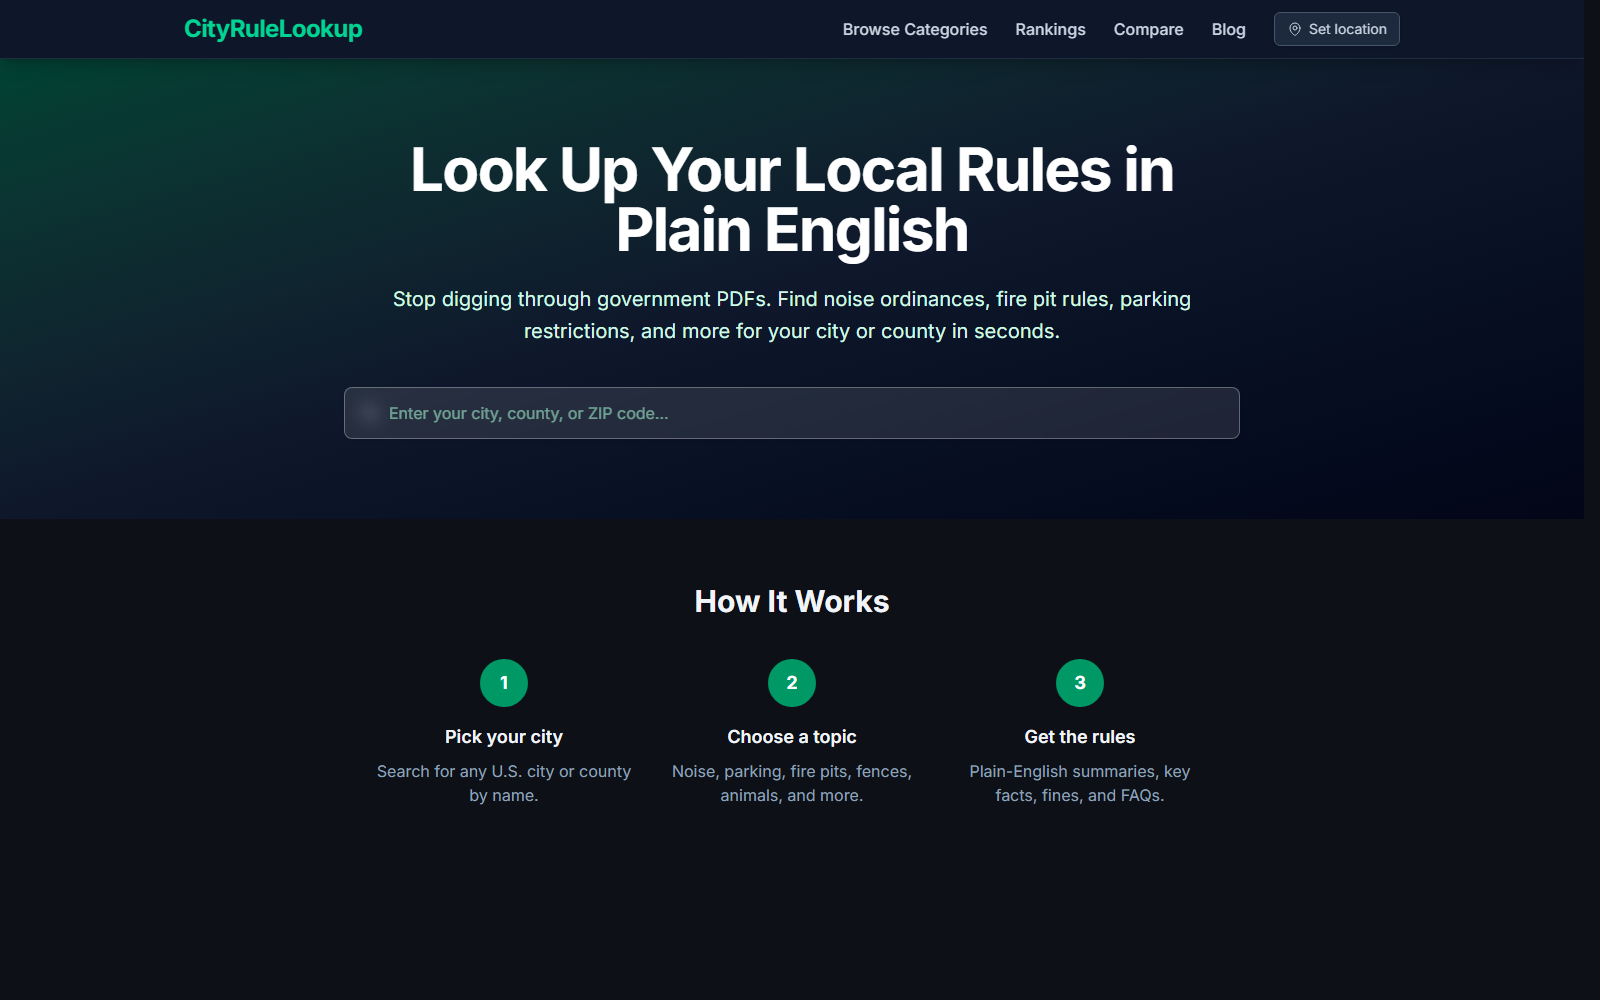
A plain-English answer to “what are the rules where I live?” for noise, parking, fences, fire pits, short-term rentals, and ADUs across 5,000+ U.S. cities and counties. It started with my own DIY projects. I founded it in March 2026, and it passed 75K monthly users within six months, built end to end by me and a team of AI agents.
>75K
monthly users in the first six months
100K+
plain-English rule summaries
5,000+
U.S. cities & counties covered
<30 days
from first commit to launch
Born in my backyard
CityRuleLookup exists because I love building things myself. Over the years I've built a deck, put up gazebos, torn walls down to the studs, redone floors, and built fences and retaining walls. Every one of those projects starts the same way: not with a saw, but with a question. Does the deck need a permit? How tall can the fence be? How close to the property line can a retaining wall go?
Getting those answers meant digging through city code websites and scanned PDFs written for lawyers, not for people like me. That is when the answers could be found at all. Nobody wants to read Chapter 9.44.010. They want to know if they can pour concrete on Saturday. People need their local rules all the time, and the answers are very hard to reach. That gap is the reason the site exists.
CityRuleLookup closes that gap. It gives plain-English answers for noise, parking, fences, fire pits, short-term rentals, ADUs, and more, and every answer links back to the official source. If a city has no rule of its own, the page shows the county rule, and then the state rule, so no page is ever empty.
Run like a product team, staffed by AI agents
Covering 5,000+ cities and counties across 58 kinds of rules is not something one person can research by hand. So I treated it as a management problem instead. I run the product the way I ran teams at Imgur, except the team is a fleet of AI agents. Claude Code leads, local models running through Ollama pick up research tasks, and the specs, quality checks, and lessons learned are all written down for them.
The code history tells the story on its own: 555 commits in five months, 60% of them written together with Claude, and thousands of research batches produced by agents, with checks standing between what the agents produce and anything that goes live.
Playbooks, not one-off prompts
Every job is written down as a step-by-step guide that a brand-new AI session can follow with no prior context: how to research, how to write, how to check, and where to pick up if it stops. The documentation is how I manage the team.
Many agents at once
Research and writing are split across as many as 20 agents running at the same time, Claude alongside local models through Ollama, each owning its own slice of the work. That is how all 50 states went from nothing to basic coverage in four days.
Biggest payoff first
Gaps in coverage are scored by how many people live there and how often people search for the topic, then filled in order. It is the same way a product team runs a backlog, except the team is a fleet of agents.
Checked before it ships
If a claim cannot be traced back to an official source, it does not go live. Automatic checks, separate review agents, and a final gate all sit between what the agents write and what search engines ever see.
555 commits · up to 20 agents at once · 50 states covered in 4 days
Trust is the product
A site that tells people what the law says has exactly one thing going for it: being right. That rule shaped everything I built. Every rule links to the official city code. When I cannot confirm a city-specific claim against an official source, the page shows the confirmed county or state rule instead of guessing.
Around the content sits a trust loop: named authors, a public editing process, a way for readers to report mistakes, and a feed of recent changes. Everything the agents write passes automatic checks and separate review agents before search engines are ever told it exists.
Seven months, fast
Feb 2026
From empty repo to live site
I set up the site, added the first Southern California cities by hand, and went live on March 1 with ads and sitemaps already in place. Claude Code was helping from the very first days.
Mar–Apr 2026
Turning content into a factory
I stopped adding cities by hand and wrote playbooks that AI agents could run in parallel. That took the site from a few cities to hundreds of counties, and then to basic coverage of all 50 states. The 50-state push was researched, written, checked, and published in four days.
May 2026
Early traction, then the rug pull
In the first two weeks of May, Google showed the site 184K times and sent 3.4K clicks, with pages landing around tenth place. Then Google rolled out a big ranking update across the whole web, and traffic from Google to the three-month-old site dropped to almost nothing.
May–Jun 2026
Finding readers somewhere else
I switched on IndexNow, which tells Bing and other search engines about changes within minutes. I also put real effort into trust: named authors, a public editing process, and a way for readers to report mistakes. Then I tuned the site for the search engines that were actually listening. Bing clicks grew about 10 times in two months.
Jul 2026
Quality, scale, and a one-day move
I ran a check across every page on the site, grew the catalog past 100K rule summaries, and moved hosting from Vercel to Cloudflare Workers in a single day.
Aug–Sep 2026
Ads go live, then the fight for clean traffic
Google approved the site for AdSense in the final days of August, and ads went live the same day. Within two weeks Google cut back the ads it would show because it suspected fake traffic. When I dug in, I found a network of robot browsers inflating both the ad requests and the visitor numbers. I spent September making the traffic honest: spotting robots, showing ads only after a real person interacts with the page, and keeping my own count of every ad.
Oct 2026
Google lifts the limit
In early October Google removed the limit completely. In the first two days back the site showed more than 20,000 ads, on an account Google had cut to a few hundred ads a day in mid-September. With the account stable and ads filling for real, I removed the ad spots people rarely saw, so the ads that remain are seen more often.
Monthly active users from Google Analytics. The flat May is Google's ranking update landing mid-month. September is the first month counted after I cut robot browsers out of analytics on September 12, so part of the drop from August is traffic that was never human.
Clean traffic over big numbers
Ads went live in the final days of August. Within two weeks Google cut back the ads it would show because of “invalid traffic concerns.” In plain terms, Google thought a lot of the visitors were not real people, so it stopped showing most ads. A month later, in early October, it lifted the limit completely. The September chart above, and the thirty days between those two dates, are what it took to earn that back. The site already blocked visitors who loaded pages too fast and visitors from a list of countries, while letting search engines through. None of that catches a robot browser that looks like a normal home internet connection. Here is what did, in the order it shipped.
Sep 5
Google limits how many ads the site can show
96% drop
in ads Google would show, Sep 4 to Sep 12 (7,839 a day down to 289)
6,233
robot browsers found and blocked in one day
Oct 5
limit lifted; 20,000+ ads shown in the first two days
Sep 5 2026
Google limits the ads, and the first culprit is me
Google cut back the ads it would show because it suspected fake visitors. I went looking for robots on the pages that carry ads and found none. What I did find was me. Since launch, 945 of my own page loads had asked Google for ads while I was checking where they sat on the page. The fix was a list of my own internet addresses. Anyone on that list gets a cookie, and every ad spot turns into a plain amber box that says it is in testing mode. I can keep checking layouts without ever asking Google for an ad.
Sep 8 2026
Remove the ad people were tapping by accident
The small ad stuck to the bottom of phone screens was getting clicked about three times as often as the ads inside the article. That was not because it was a good ad. Its close button sat right on top of it, so a thumb aiming for close often hit the ad instead. Google counts accidental clicks as fake clicks. I turned the phone ad off and moved every close button well away from the ads.
Sep 12 2026
Find the robots
A network of robot browsers was loading pages all day from thousands of ordinary home internet connections across the U.S., pretending to be a different person each time. On one day it came from 6,233 different addresses and loaded about 12,000 pages. That was roughly half of what Google Analytics was counting as real users. Every one of those loads asked Google for an ad. Google noticed, and within eight days it cut the ads it would show from 7,839 a day to 289. My second analytics tool never saw these visitors at all, and that difference is what gave the robots away.
Sep 12 2026
Ads only for people
Robots and people behave differently in a browser, so the site now checks before it loads any ad code. A browser that admits it is automated never gets ads or analytics. A browser that looks suspicious, like a very old version of Chrome, only gets ads after a real tap, click, or key press. Everyone else gets ads on their first touch of the page, or after four seconds of actually looking at it, whichever comes first. Scrolling does not count, because the robots scroll too. The next day I added a Cloudflare rule that asks suspicious visitors to prove they are human before the page loads.
Sep 24–28 2026
Count every ad myself
Google only tells you how your ads did once a day, as one total. So I started keeping my own score. For every ad spot, did an ad arrive, and did a person actually see it, meaning half of it on screen for a full second. Ad spots that are hidden on your screen size no longer exist at all, so Google is never asked to fill an ad nobody can see. After five days the picture was clear. A handful of ad spots earned pennies and were rarely seen, so I removed them. Fewer ads asked for, and the ones left get seen more often, which is exactly what Google rewards.
Sep 25 2026
Give Google a shorter reading list
I had handed Google a list of 173,000 pages, and it had indexed none of them. It was visiting a few hundred pages a day while Bing visited around 20,000. So I gave Google its own shorter list: the 35,000 most-visited pages, picked from a month of real traffic. I also told it to stop spending visits on comparison and widget pages that were never meant to show up in search.
Early Oct 2026
The limit comes off
A month after it started, Google lifted the limit with no strings attached. At the lowest point it had been showing 289 ads a day. In the first two days back it showed more than 20,000. There was no appeal and no argument. I made the traffic clean and kept my own count, and Google's own checks agreed.
The trade was simple: a smaller number that an ad network, a search engine, or a hiring manager can trust, instead of a bigger number none of them should. Google agreed within thirty days. Every change above is a reviewed pull request that spells out the measurement behind it. That is also why, the moment the limit lifted, I already knew which ads to keep and which to cut.
Growing without Google
The interesting part of growing past 85,000 monthly users is not the number. It is where those people come from. After Google's May ranking update, I rebuilt the audience almost entirely on Bing, Yahoo, and DuckDuckGo, with a long tail from Ecosia and AI assistants like ChatGPT. Google normally sends more search traffic than every other engine put together. Here it sends about 2% of search visits.
Visits with no referrer (65K) are left out. Google Analytics, 90 days to mid-August, the last window before I cut robot traffic out of analytics. Google is the one still on the table.
That is the opportunity for the next two quarters. I built this audience while the biggest search engine was barely sending anyone. If Google rankings get back to even where they were in early May, search traffic could roughly double without my adding a single new page.
The numbers
85K
peak monthly users (Aug 2026)
58K
monthly users once bots were filtered out (Sep 2026)
10×
Bing click growth, Apr to Jun
2m 35s
average time spent per visit
50
states with full baseline coverage
1.6K
visits sent by ChatGPT
Under the hood
- Frontend
- Next.js 16 (App Router, ISR), React 19, Tailwind CSS v4
- Data
- Supabase (Postgres) holding 100K+ rule summaries. If a city has no rule of its own, the page falls back to the county, then the state, so no page is ever empty
- Infrastructure
- Cloudflare Workers via OpenNext, with an R2-backed page cache and a Durable Object queue for refreshing pages. Moved from Vercel in one day
- Content pipeline
- Claude API plus parallel agent fleets, local models via Ollama for research, automatic checks before publishing, and IndexNow so search engines hear about changes right away
- Analytics
- GA4 and PostHog, plus my own insights dashboard on an admin subdomain
- Monetization
- Google AdSense
See it live
Look up your own city, or get in touch if you want to talk about product, AI-agent workflows, or what it takes to ship this fast.